2025: piccard2
Skills: Clustering algorithms, data visualization and spatial data in Python, package deployment
Supervisor: Prof. Fernando Calderon Figueroa (Dept. of Human Geography, UofT Scarborough)
In summer 2025, I participated in the Summer Undergraduate Data Science (SUDS) program's 2025 cohort working on an update to piccard, a Python package intended to make it easier to analyze geographically inconsistent census data using a graph data structure. You can learn more about piccard here and install it via PyPI.
View the git repo here.
2024: GTA Urban Emissions Project
Skills: Full-stack web development, PHP, PostgreSQL, Salesforce products, Leaflet web mapping, spatial analysis with R and ArcGIS
Supervisors: Profs. Robert Soden (Dept. of Computer Science, UofT St. George) and Debra Wunch (Dept. of Physics, UofT St. George)
In the summer of 2024, I participated in the Toronto Climate Summer School, during which my collaborators and I investigated a previously unknown source of methane in Toronto's Junction neighbourhood. That fall, I continued my work with Prof. Wunch's GTA Urban Emissions Project as an independent study. I conducted statistical and spatial analysis to identify possible new sources of methane emissions in Toronto, developed a comprehensive citizen science strategy for the GTA Urban Emissions Project, and designed a new user-friendly website for the group.
View the updated website here and the git repo here. Also, my final paper for the independent study is available on the writing page.
2024: The TTC Improvement Game
Skills: Python GUI creation and deployment with NiceGUI, Docker and fly.io, graph creation and visualization
A silly little interactive visualization I made for a first-year CS course. It models TTC stations and lines as a graph (piccard foreshadowing!!), allows the user to edit the subway map, and calculates the effect on ridership.
View the updated website here and the git repo here.
2023: Bound to Big Oil Report
Skills: Webscraping, excel sheet manipulation with pandas
In the fall of 2023, I wrote Python scripts to automate data collection for Climate Justice UofT's 2024 Bound to Big Oil Report. View the report here and the git repo here.
Skills: Webscraping, excel sheet manipulation with pandas
In the fall of 2023, I wrote Python scripts to automate data collection for Climate Justice UofT's 2024 Bound to Big Oil Report. View the report here and the git repo here.
Other (offline) projects
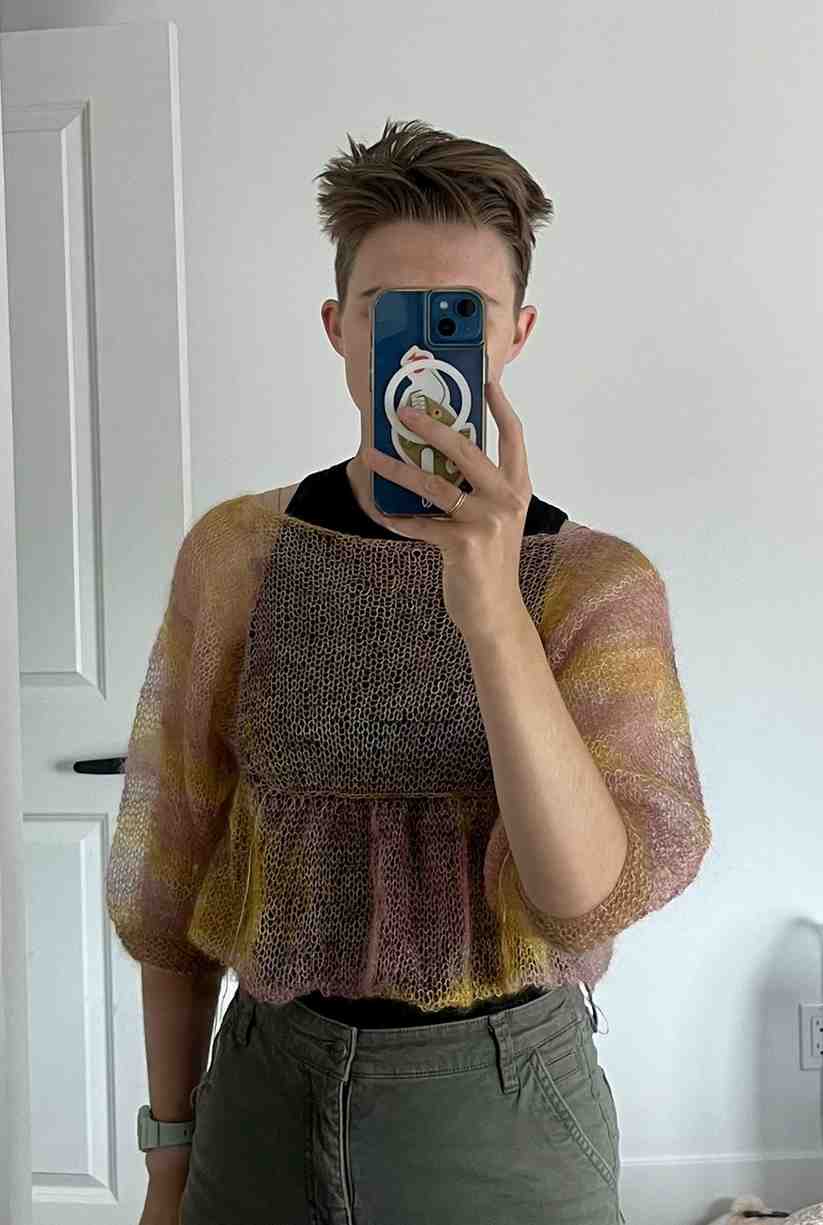
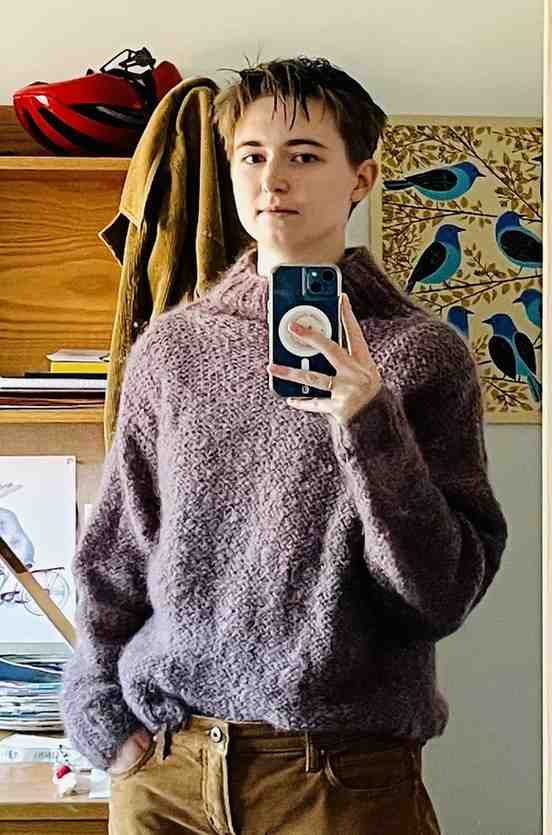
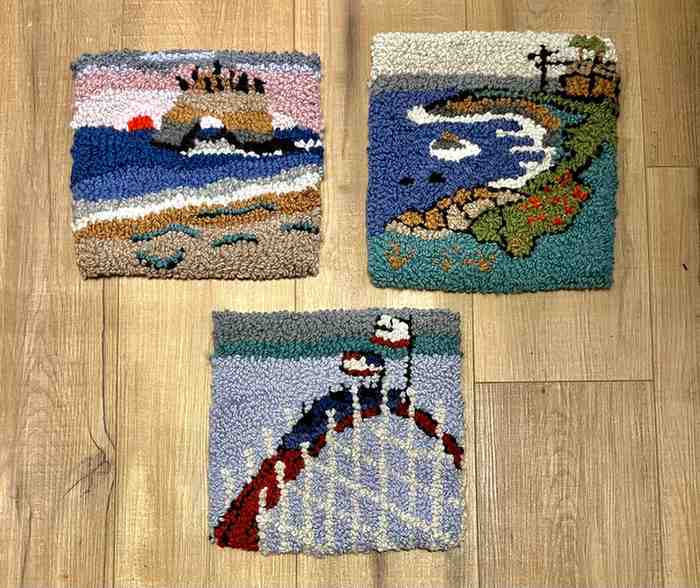
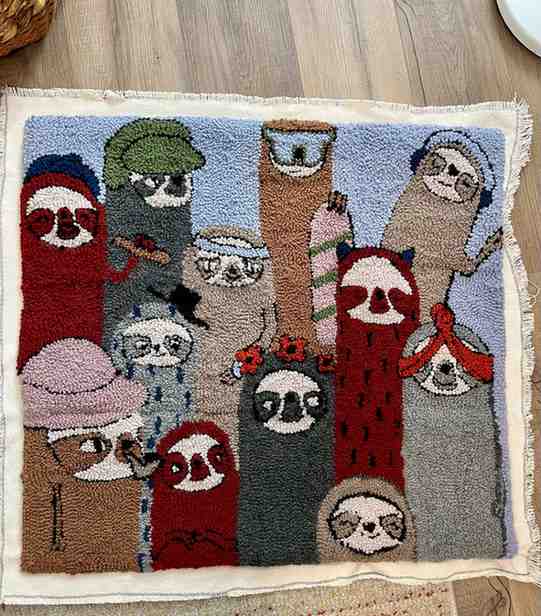
Some yarn crafts I've made: two tops and four rugs.